Finance Dashboard
Creator — end-to-end development: architecture, components, CRUD for transactions and investments, charts, crypto data integration and global state with Pinia.
- Vue 3
- TypeScript
- Tailwind CSS
- Pinia
- Vue Router
- Chart.js
- Vite
- Axios
Problem
Managing personal finances while also tracking crypto investments usually takes separate tools: an expense tracker and an exchange or portfolio app. This project puts everything in one dashboard — balance, income/expenses and the crypto portfolio side by side.
Solution
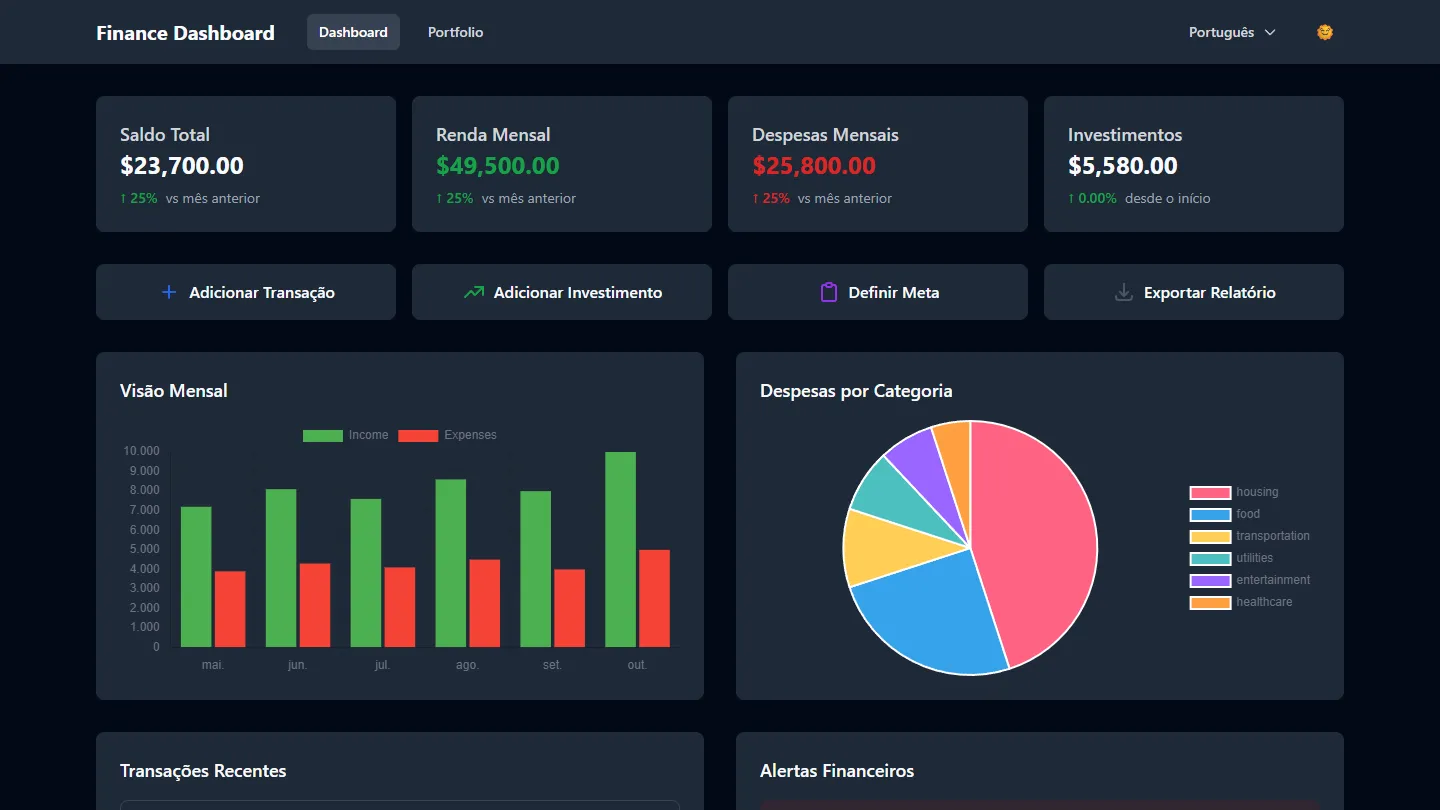
A Vue 3 + TypeScript (Vite) app with two main areas: Dashboard (total balance, monthly income/expenses, monthly chart, expenses by category and recent transactions) and Portfolio (real-time portfolio value, gains/losses, asset allocation and performance history). Transactions and investments have full CRUD with confirmation modals, and the app includes financial goals and an i18n structure with locales. Crypto data lives in a dedicated service layer (cryptoService.ts), decoupled from the views.
Overview
A financial dashboard that combines personal finance tracking and crypto portfolio management in a single interface, with interactive charts (Chart.js), light/dark mode and a responsive layout. ISC license.
Features
Main dashboard
- Total balance at a glance.
- Monthly income and expense tracking.
- Monthly overview chart and expenses by category.
- Recent transactions with full CRUD (create, edit, delete with a confirmation modal).
- Financial goals (dedicated form).
Crypto portfolio
- Total portfolio value tracked with real data (cryptoService).
- Gains/losses view.
- Asset allocation chart and performance history.
- Management of investments and crypto transactions, with coin selection.
Technical decisions
- Global state with Pinia (
src/store), keeping financial and portfolio data out of the views. - Isolated service layer (
src/services/cryptoService.ts): crypto data access is separate from the components, making it easier to maintain and to swap data providers. - Focused components: charts (
MonthlyChart,ExpenseChart,PortfolioAllocationChart,PortfolioHistoryChart), form modals and lists (TransactionList,InvestmentList,CryptoTransactions) — one responsibility per reusable component. - i18n with locales (
src/i18n/locales), so the structure is ready for multiple languages. - Chart.js for all four visualizations, and Axios as the HTTP client in the service layer.
What I learned
- Modeling CRUD for different domains (transactions and investments) with global state and reusable modals.
- Integrating dynamic crypto data while keeping the API layer decoupled from the UI.
- Structuring a dashboard with several charts and metrics without sacrificing performance or code clarity.